D0bbie
Novice Member
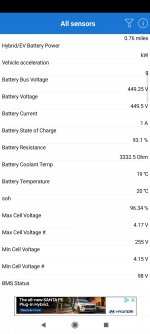
As posted on another thread, using the Thai app has shown that over the last 3 months, the SOH of my ZS EV has worryingly dropped from 99.5% to 96.34%.
Today I also took it out for a drive consisting of 137.5 miles at 3.9 kw which took the battery down to showing as 10% when plugged back in to charge, which I work out as a battery capacity of 39.17kwh (Hopefully someone will confirm or correct the maths on that!).
For info, I've done just over 21k miles.
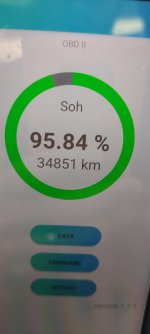
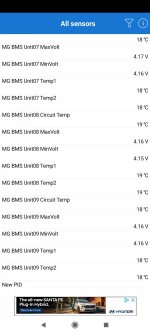
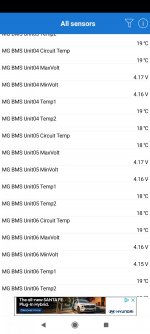
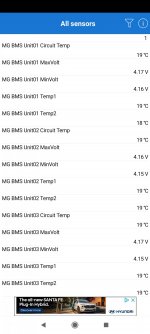
After a full overnight charge and balance, Car Scanner showed the attached info. To the untrained eye it doesn't look like anything untoward is going on fuel cell wise that would explain the relatively sudden drop in SOH?
I'd be grateful if someone with a more trained eye could take a look. Cheers.
Today I also took it out for a drive consisting of 137.5 miles at 3.9 kw which took the battery down to showing as 10% when plugged back in to charge, which I work out as a battery capacity of 39.17kwh (Hopefully someone will confirm or correct the maths on that!).
For info, I've done just over 21k miles.
After a full overnight charge and balance, Car Scanner showed the attached info. To the untrained eye it doesn't look like anything untoward is going on fuel cell wise that would explain the relatively sudden drop in SOH?
I'd be grateful if someone with a more trained eye could take a look. Cheers.
Attachments
-
 Screenshot_2021-06-05-09-14-06-309_com.ovz.carscanner.jpg156.4 KB · Views: 381
 -
 Screenshot_2021-06-05-09-13-54-923_com.ovz.carscanner.jpg163.7 KB · Views: 381
 -
 Screenshot_2021-06-05-09-13-44-487_com.ovz.carscanner.jpg160.3 KB · Views: 402
 -
 Screenshot_2021-06-05-09-13-26-674_com.ovz.carscanner.jpg145 KB · Views: 370